

What's In a Number? Decoding El Niño's Digits
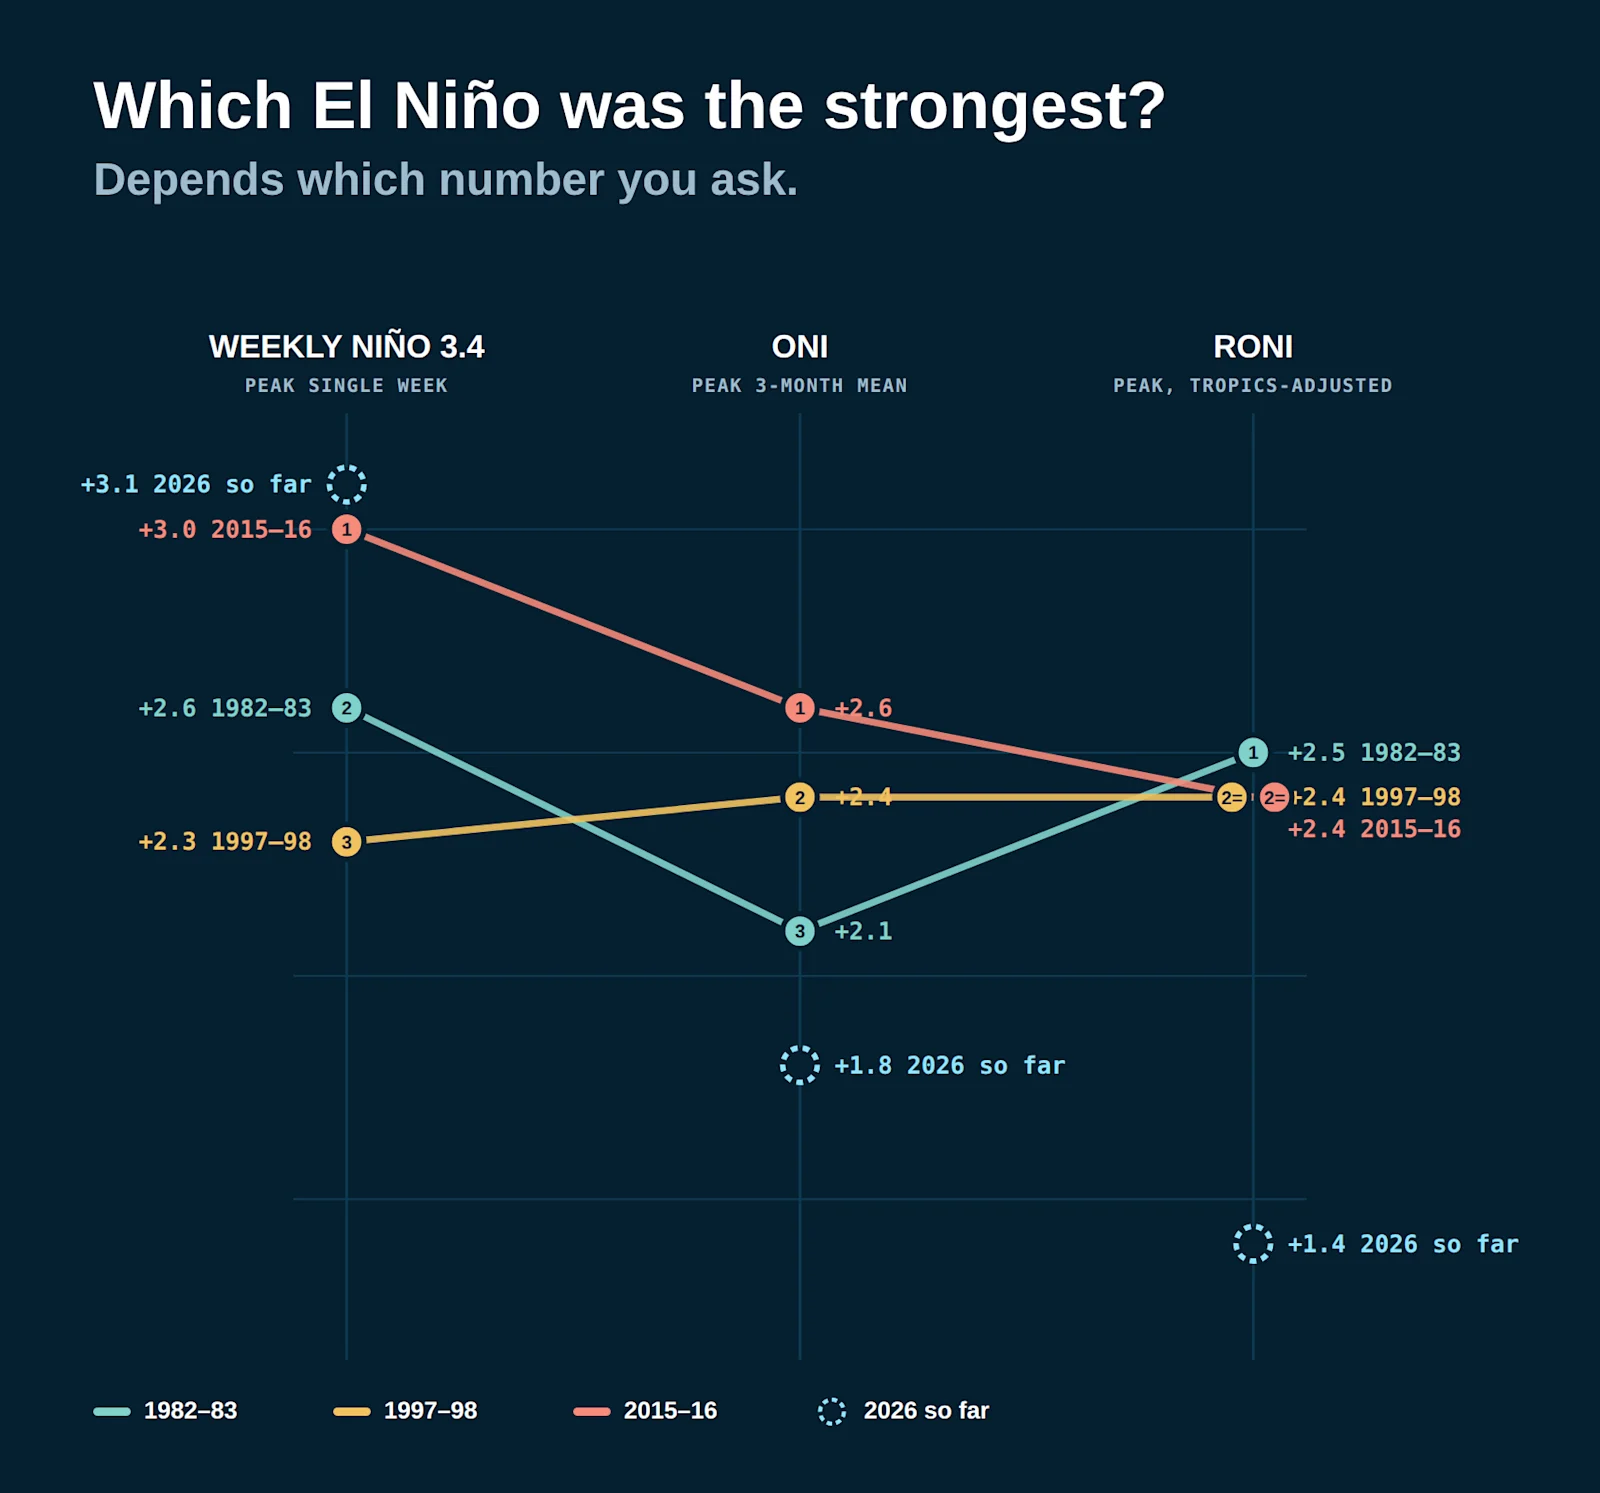 The three different scales show the peak reading during each 'Super' El Niño event. The weekly reading (left) has surpassed prior year, setting a new record. The ONI and RONI are still climbing. Those readings are expected to challenge the records between November and January.
 Is the current El Niño reading +3.1, +1.8, or +1.4? The answer is... yes.
Keeping track of the El Niño Southern Oscillation (ENSO) number can get confusing fast. Several different readings are in play when sizing up an El Niño, and to make things even more complicated, NOAA adopted a new official index this year. We'll try our best to simplify things:
Where?
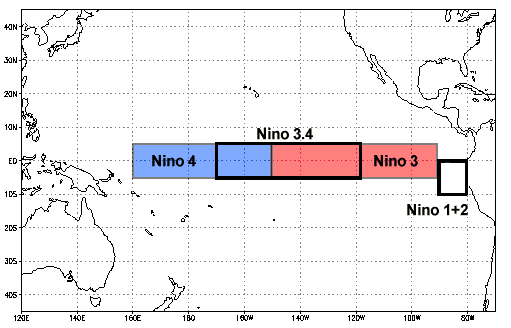
Surface water temperatures in four "Niño Regions" along the equator in the Pacific determine ENSO. Region 1+2 sits off the coast of Peru and Ecuador. Region 3 covers the Eastern Pacific, and Region 4 covers the Central and Western Pacific. The most important is Region 3.4, which overlaps parts of Regions 3 and 4. This is where most values are reported, and it's the patch of ocean the atmosphere responds to most.
When?
Three readings come out of Region 3.4: weekly, monthly, and a three-month rolling average called the Oceanic Niño Index, or ONI. The weekly reading offers a "live" look at what's happening in the Pacific, but it can swing from one week to the next. The monthly average is what NOAA uses to declare El Niño "conditions," meaning the water is running warm and the atmosphere is responding. The monthly readings feed the ONI, the official three-month number. When the ONI holds at or above +0.5°C for five consecutive overlapping three-month periods, then NOAA writes it down as an El Niño "event."
How?
How far above average the water runs determines the strength. Within half a degree C of normal is neutral. +0.5 to +1.0°C is weak, +1.0 to +1.5°C moderate, and +1.5 to +2.0°C strong. Above +2.0°C is very strong, the so-called "super" territory. Those labels apply to an event's peak three-month value, not to any single week.
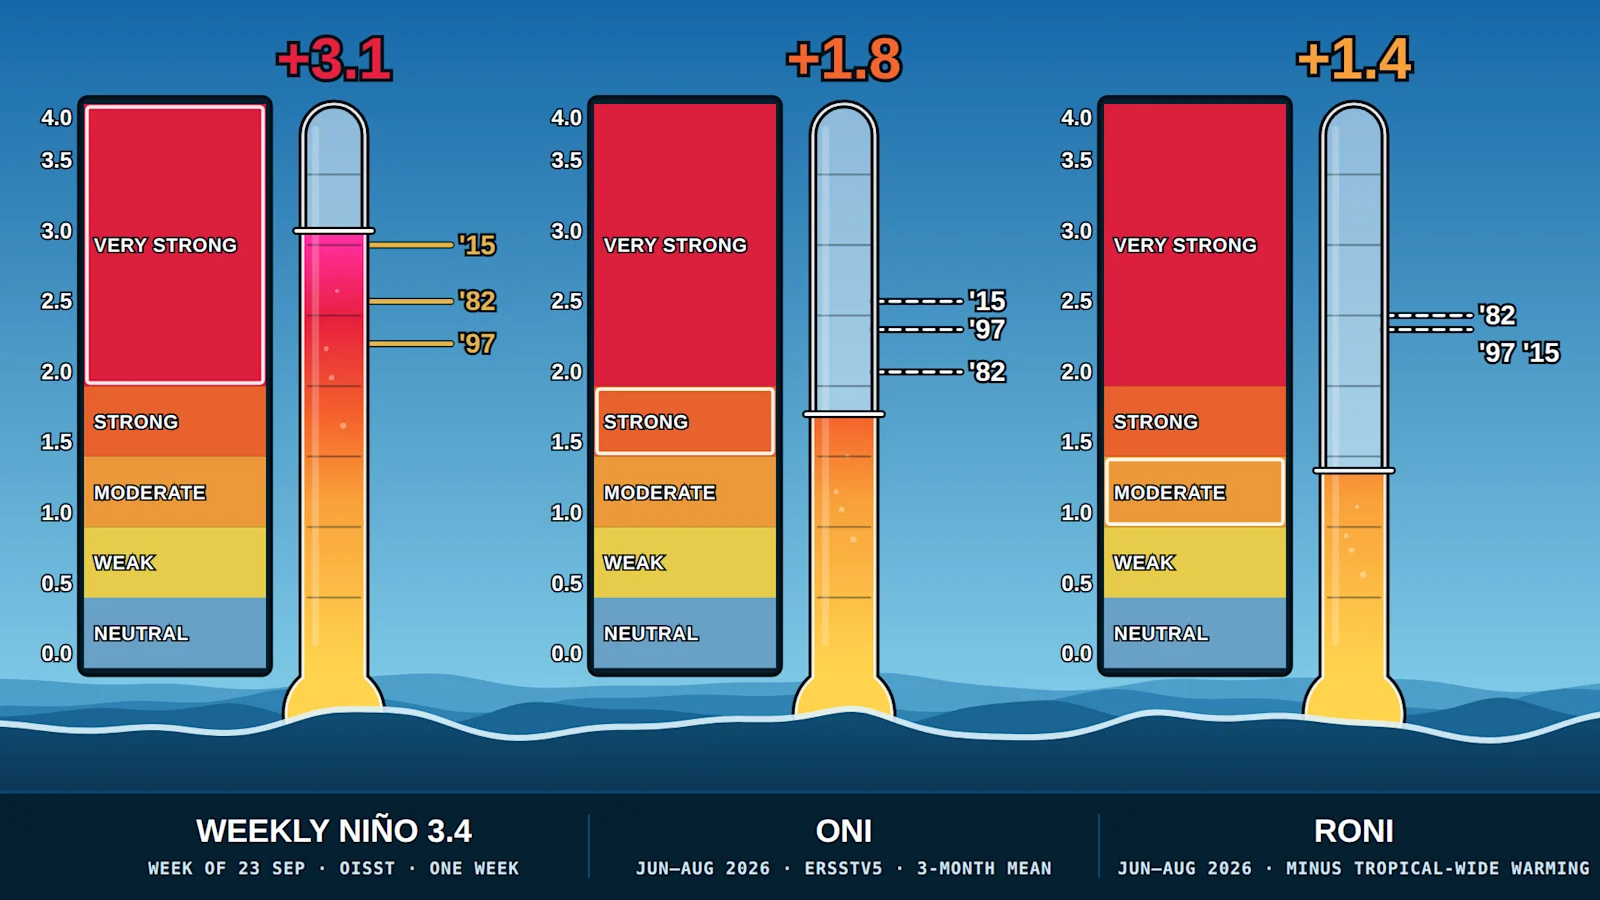
Three different readings, three different rankings place the current and still-rising El Niño anywhere from first to fourth. So far.
Why?
This year NOAA made the Relative Oceanic Niño Index, or RONI, its primary standard for official El Niño advisories and classifications. ONI compares Region 3.4 to its own 30-year average. RONI first subtracts how warm the entire tropical ocean is, so it measures how much hotter 3.4 is than the rest of the tropics. That's the contrast the atmosphere actually feels, and it accounts for a warming planet.
What?
Current readings:
-
+3.1°C: Weekly 3.4 (September 28th)
New weekly high in 45 years of records, edging past the +3.0°C set in November 2015, and reaching that level nearly two months earlier in the season. -
+1.8°C: ONI (June–August)
Strong El Niño, but the three-month average lags the weekly surge and still trails past events and 2015-16's record +2.6°C. -
+1.4°C: RONI (June–August)
Moderate on the new scale, well behind past events and the record +2.5°C set in 1982-83.
0 comments